Solar Financial Proposals Built for Serious Solar Teams
Kingdom Light Solar Strategy™ (KLSS) helps solar companies create transparent, investment-grade financial proposals without spending hours in spreadsheets.
Go From Utility Bill to Financial Proposal Faster

Build Quotes Faster
Templates, defaults, and smart workflow help you build accurate proposals in minutes.

Explain the Investment
Clear visuals and financial projections help customers understand the value.

Standardize Your Sales Process
Give your team a consistent proposal workflow instead of scattered spreadsheets and one-off calculations.

Present With Confidence
Professional, branded proposals help build trust and win more deals.
Everything Included
Every plan includes the full KLSS platform. No feature gating. No hidden add-ons. No upgrade traps.
✔️ Contact and deal management
✔️ Quote creation workflow
✔️ Utility-rate modeling
✔️ Monthly usage analysis
✔️ System and battery configuration
✔️ Financial projections
✔️ Loan and payoff modeling
✔️ Tax and incentive inputs where applicable
✔️ Customer-facing reports
✔️ Presentation tools
✔️ Shareable proposal links
✔️ Admin controls
Built for Financial Clarity, Not Panel Design
KLSS is not trying to replace every solar design tool. It is built to strengthen the financial side of the sale: utility modeling, long-term projections, financing strategy, payoff analysis, and customer-facing explanation.

See KLSS in Action
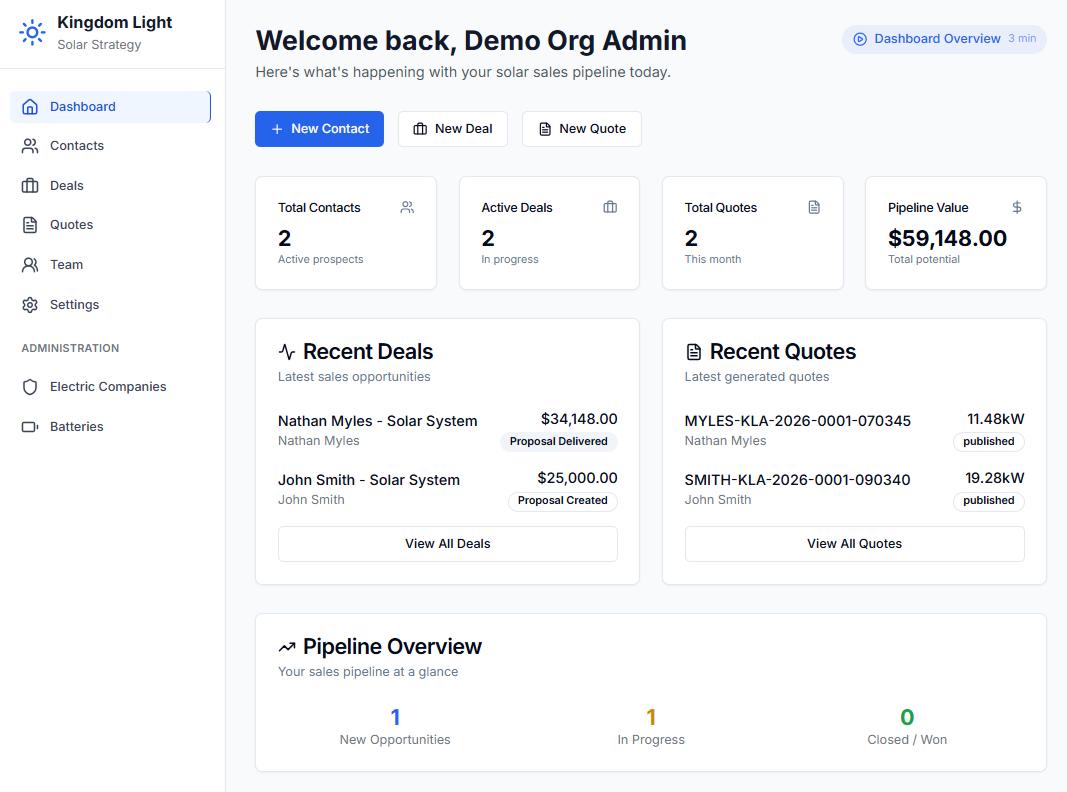
Dashboard / CRM
Track contacts, deals, and quotes in one organized workflow.
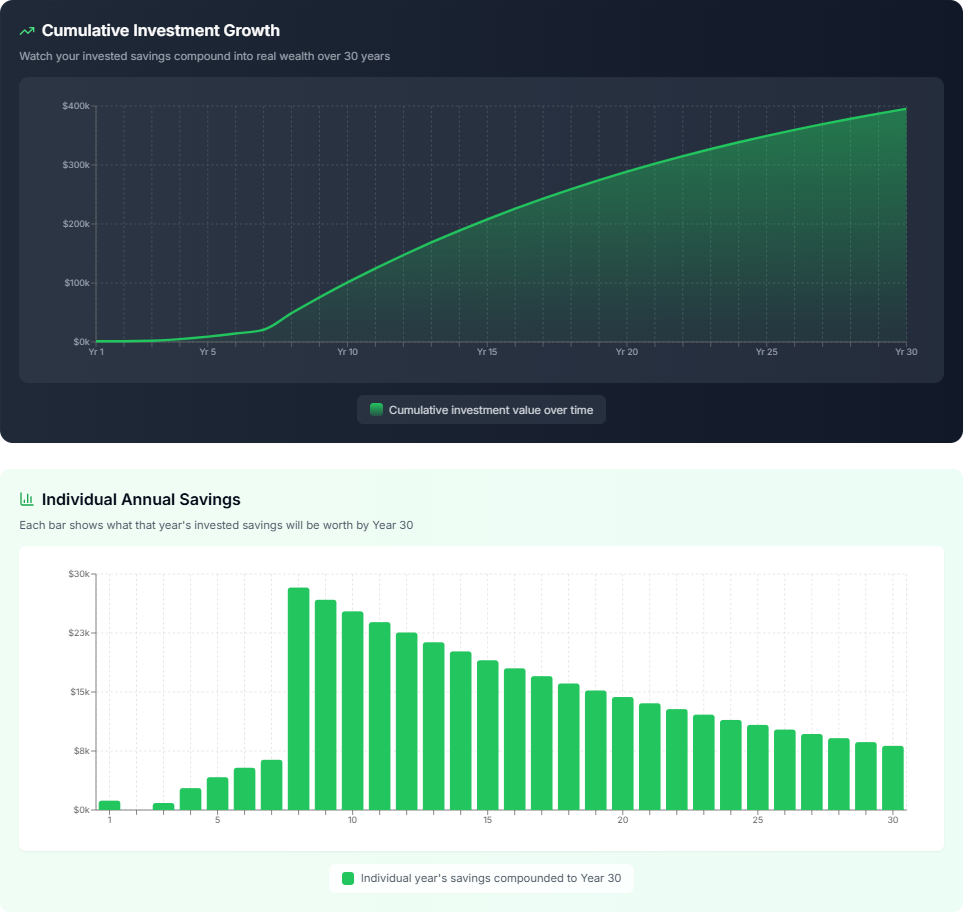
Financial Reports
Show the full financial picture instead of only a monthly payment.
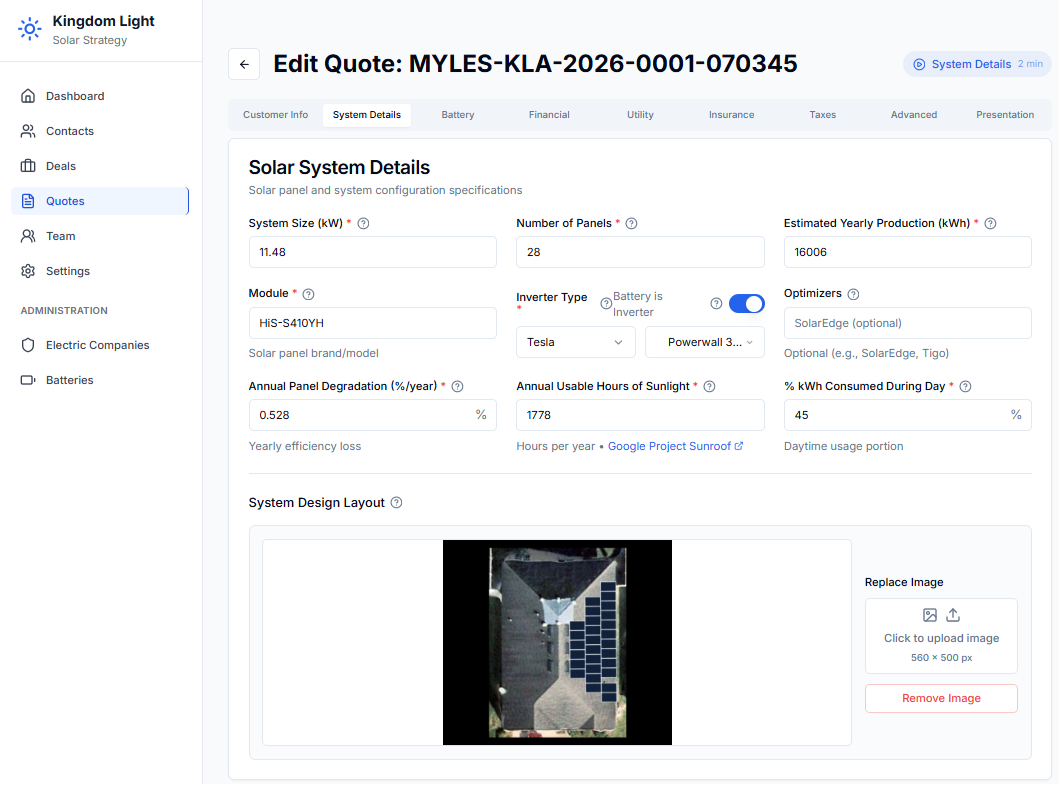
Build proposals using customer-specific system, financing, and utility data.
Quote Builder
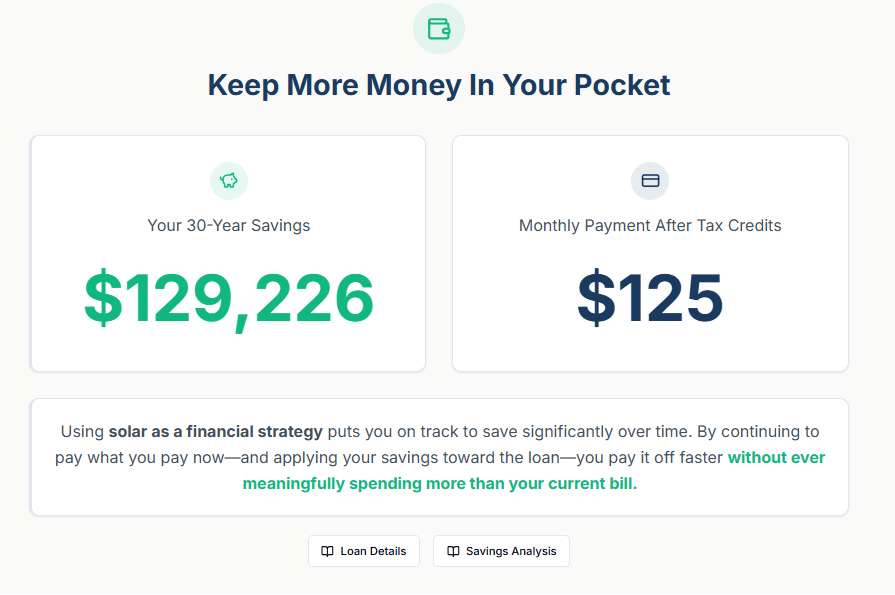
Presentation Preview
Use presentation-ready outputs during sales conversations.
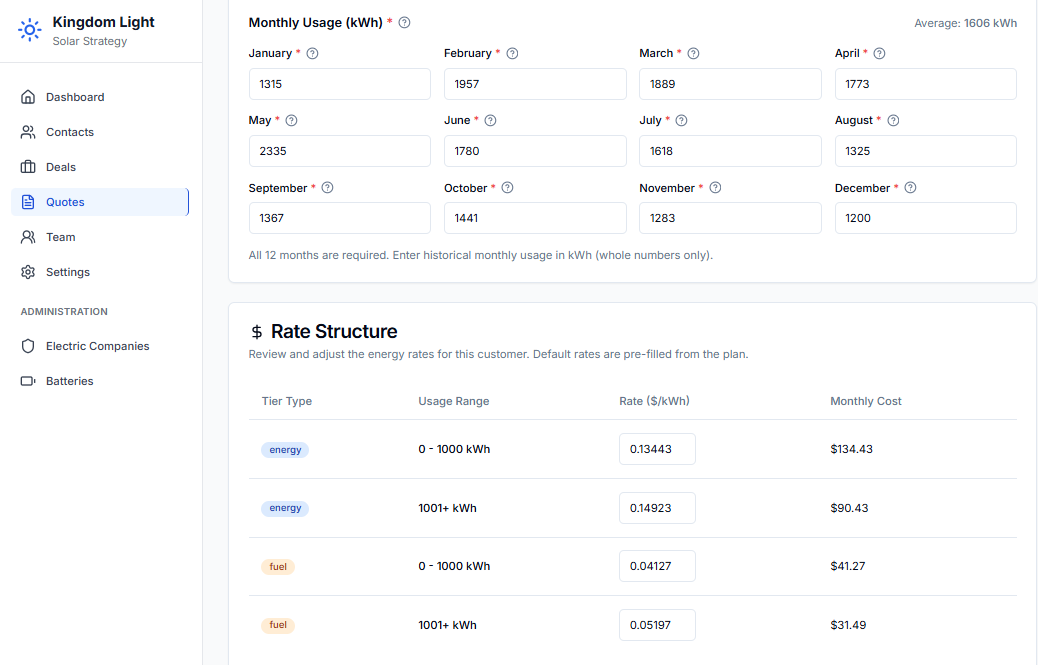
Model utility costs with the detail needed for long-term savings projections.
Utility Modeling
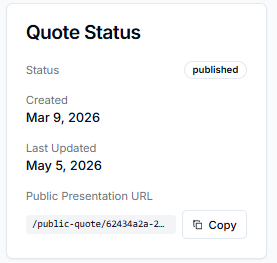
Shareable Proposal
Give homeowners a clear, organized proposal they can review.
Built From Real Solar Conversations
KLSS was shaped through real homeowner questions, proposal reviews, and solar sales conversations. That experience shaped the platform’s reports, explanations, and presentation flow.

See KLSS With Your Own Numbers
The easiest way to understand KLSS is to walk through a real proposal. We’ll show how the platform can support your sales process and help your team present solar with greater clarity.